200 DMA to be a critical level indicative of the bullish or bearish trend in the price of gold

Jonathan Jossen, a gold options trader at the COMEX, stated in comments to Reuters that “People who are long gold are getting out. They don’t like what’s going on with Greece and the stock market is decisively lower. It’s a matter of raising money.”
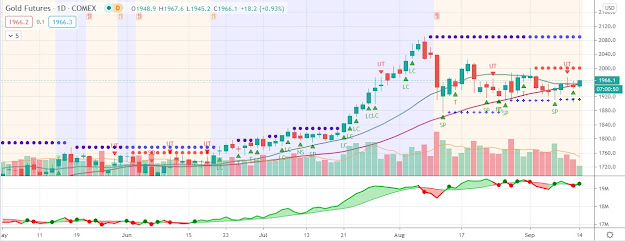
Analysts at Commerzbank wrote in a note to clients that “There is still a correlation between gold and risky assets such as equities and industrial commodities. This is probably due to investors with a short-term horizon selling long positions on the futures market.” At its current level, the gold price is now sitting right on its 200-day moving average (DMA) of $1,673.98 per ounce. Many traders consider the 200 DMA to be a critical level indicative of the bullish or bearish trend in the price of gold. Yesterday, several traders contended that if the gold price falls decisively below its 200 DMA, further selling could materialize.
While such a technical perspective may be widely followed, history suggests that it does not work well as a timing indicator by which to invest. During the ongoing 11-year gold bull market, the gold price has dropped under its 200 DMA on numerous occasions– including in 2003, 2004, 2005, 2006, 2008, 2009, 2011, and earlier this year.
Although calls arose each time for the end of the bull market, every instance marked an important bottom in the price of gold. Moreover, during the corrections the gold price declined on average only 3.7% below its 200 DMA. While the latest challenging period for the gold price could persist, the evidence therefore indicates that the weakness is meant to be bought rather than sold.

Comments
Post a Comment