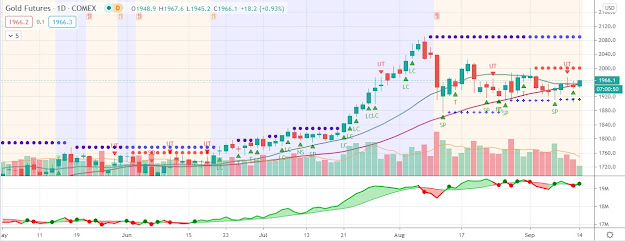
The Gold Price
very nearly broke upward through its since-August-2013 downtrend line
this week, the chart shows a double bottom, other indicators are
floating upward, and it has broken through its 20 week moving average. The daily chart is just too beautiful to miss. Look here, The gold price hath climbed straight up from an upside-down head and
shoulders up through the neckline, broken through old resistance from
$1,290 - $1,300, and today closed above its 200 DMA for the first time
since February a year ago.
Only problem with this picture is that it can leave us so giddy that we
overlook that stochastic indicator that is flashing a warning. I don't
think this rally has ended, but around $1,350 - $1,360 it will likely
begin losing altitude. This rally has run since 31 December 2013.


Comments
Post a Comment